VB Watch Debugger Windows
The Debugger provides many windows to help you understand how your
program is really behaving.
-
Those windows are dockable. You can close those that do not interest you and bring them back with the show Windows button.
-
To filter info per application, select a thread tab. To see the info of all threads mixed together, select the Common tab.
-
Use the right mouse button on any item: this will bring a context menu that allows to access the corresponding item in another window, or to open the original source code and pinpoint the item to the corresponding line.


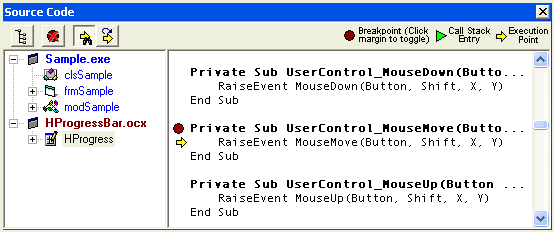
This window displays the original source code. You can follow the execution
here, or even set breakpoints at runtime.

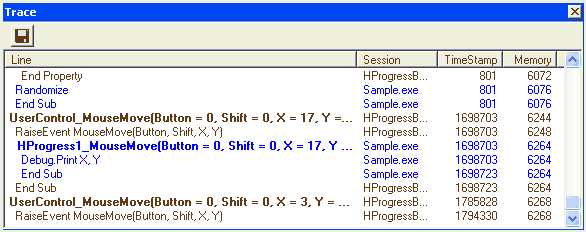
This window shows lines and procedure calls as they are executed.
When more than one executable are running (typically an exe with some
ocx/dll), the Trace window of the Common tab is very
useful for analysing interactions between each.

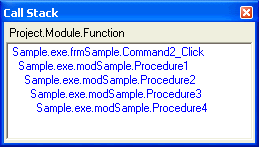
This window displays the call stack in real-time.

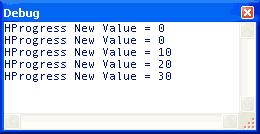
This window captures the Debug.Print statements that are
executed in your code and displays the output as if you were in the
Immediate window of the VB IDE.


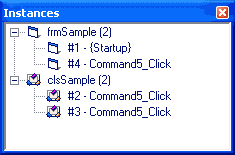
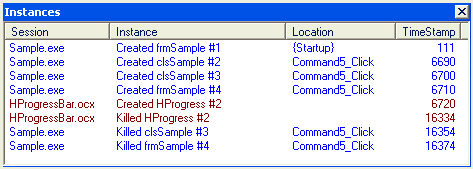
Have you ever tried to debug an object that doesn't terminate as
expected or a form that stays in memory even when it's supposed to
unload ? The debugger keeps a count of all active forms, classes and
user controls, telling when and where they were created or destroyed
so that you can easily figure out what's going wrong.

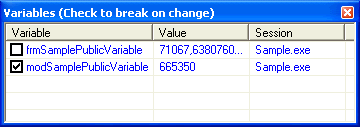
This window displays the value of critical public variables in real time.
You may break the application when a value changes.

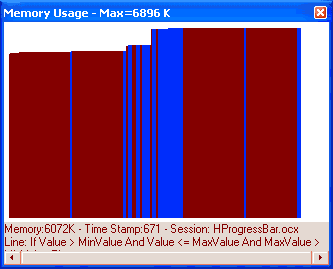
This window displays graphically the total memory your application is using. Use this to find about memory leaks.
By just moving the mouse over a part of the graph you can discover where and when in your code it was measured.

